

I really like Google Data Studio because it’s a versatile tool that can be used to visualize and partially manipulate data. In many cases, I replaced a classic Excel report with a Data Studio dashboard, because I find it easier to share a report within an organization.
I also use the official Google Search Console connector for SEO analysis and today I’m gonna show you how I manipulate Search Console data using some of the functions of Data Studio.
If you try to use the Search Console connector you’ll see that you can choose between two different datasets:
- Site Impression
- URL Impression
The main difference between the two datasets is that the Site Impression dataset contains the Average Position metric, while the URL Impression has the Landing Page dimension.
1 Calculate the accurate amount of Impressions
If you decide to use the URL Impression table you could notice some discrepancies in the data. This is can happen because clicks, impressions and CTR data are aggregated on different levels. URL CTR and URL Clicks are aggregated by page while the column Impressions are aggregated by Query.
E.g. if you two URLs are ranking for the same query you’ll have these data:
URL Clicks: 1
Impressions: 2
URL CTR: 100%
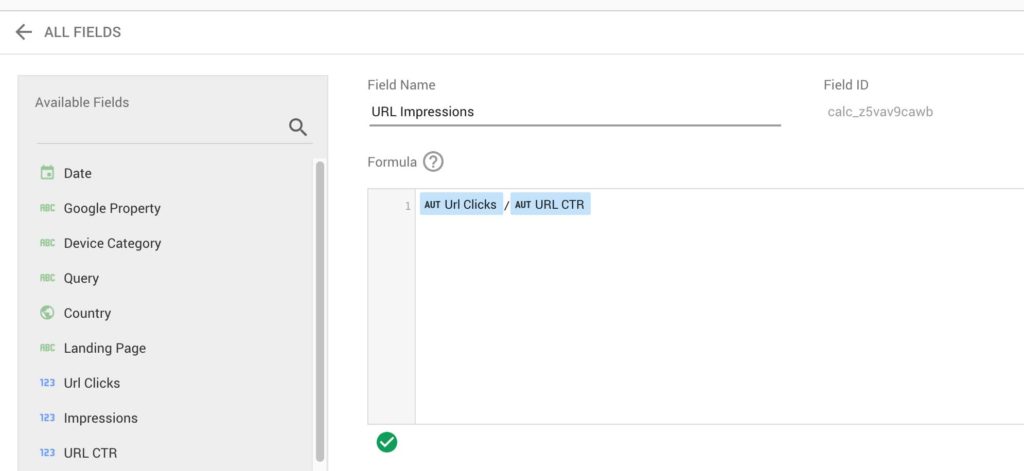
In this case, you can’t calculate CTR by multiplying URL Clicks and Impressions because two URLs generated an Impression. But there is a simple workaround to calculate the number of Impressions generated by every single page.
You have to add a custom field to your data source and divide the URL Clicks by the URL CTR and you’ll get a new column that you can name URL Impressions.
2 Branded vs Non-Branded traffic (+ folders grouping)
If you want to have a clear overview of the organic visibility of your website you should split the brand and non-brand traffic. You can easily do that using the Custom Fields.
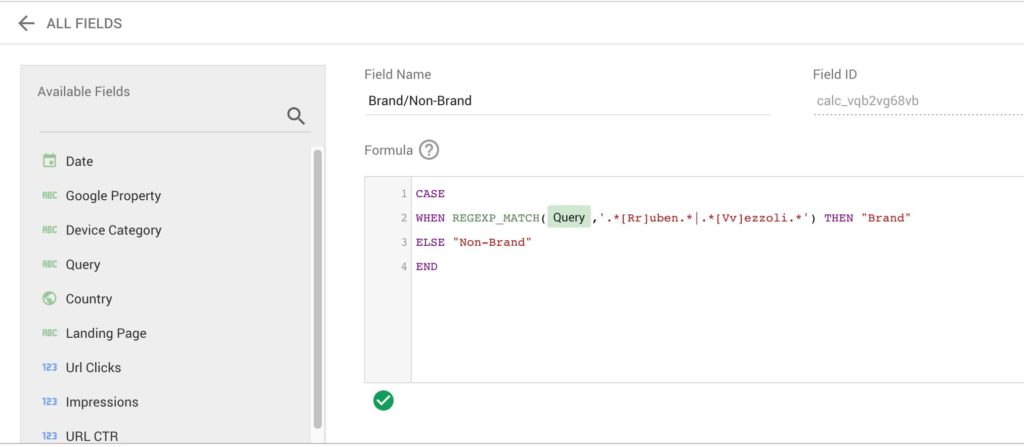
Open the data source dashboard by clicking on the pencil near the data source name. Then click on Add a Field and there you have to paste the code you can find below.

Basically, I combine a CASE statement with regular expressions to “label” automatically every single query. Inside the regex, I put all the brand names and the misspelled versions.
|
1 2 3 4 |
CASE WHEN REGEXP_MATCH(Query,'.*brand.*|.*misspelling.*') THEN "Brand" ELSE "Non-Brand" END |
This custom field should be a dimension with a text format and it can be used as filter or breakdown dimension.
You can use the same logic to group different pages of the same folder. In this case, you have to replace Query with Landing Page and write all the regular expressions (!!you can use multiple WHEN in a CASE statement!!).
3 # of unique Search Queries
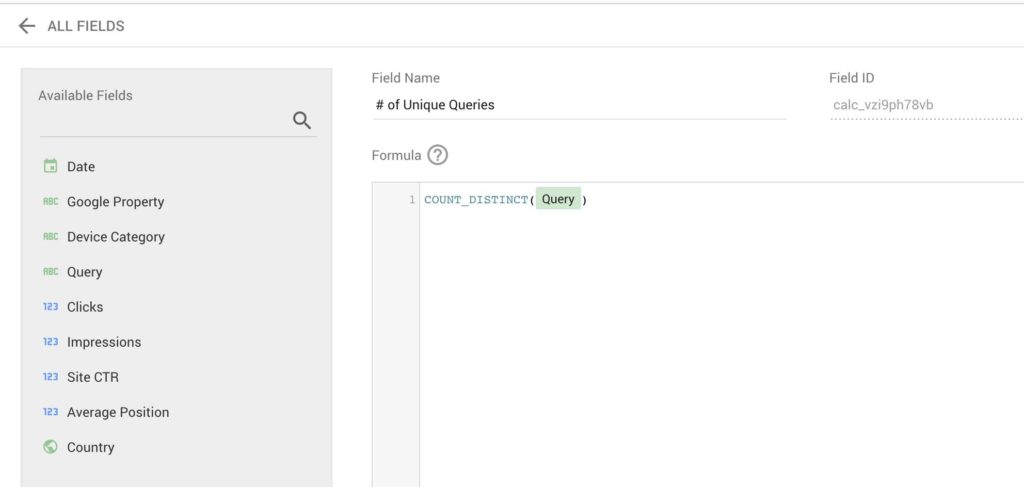
The COUNT_DISTINCT() function counts the number of unique values in a column. It’s very helpful when I want to know for how many different queries a URL is shown.
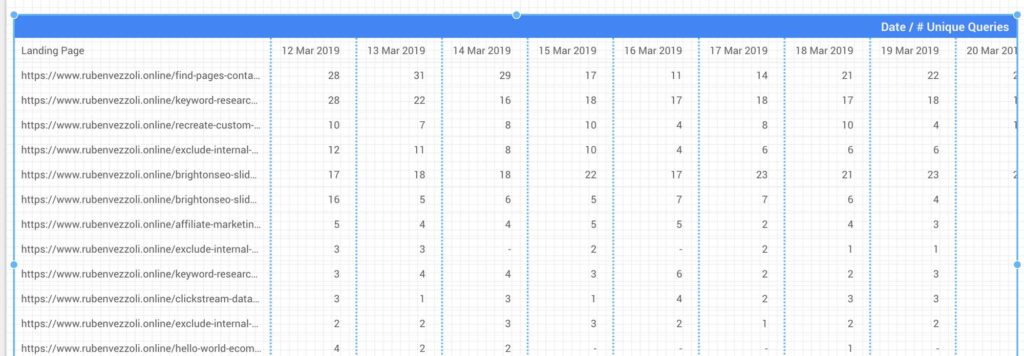
In the screenshot below, I created a pivot table (Raw = Landing Page, Columns = Date, Metric = # unique queries)who shows the development of the # unique search queries per page.
4 Detect Keyword cannibalization
I also use COUNT_DISTINCT() to detect queries where two or more pages of the website are competing against each other (Keyword Cannibalization).
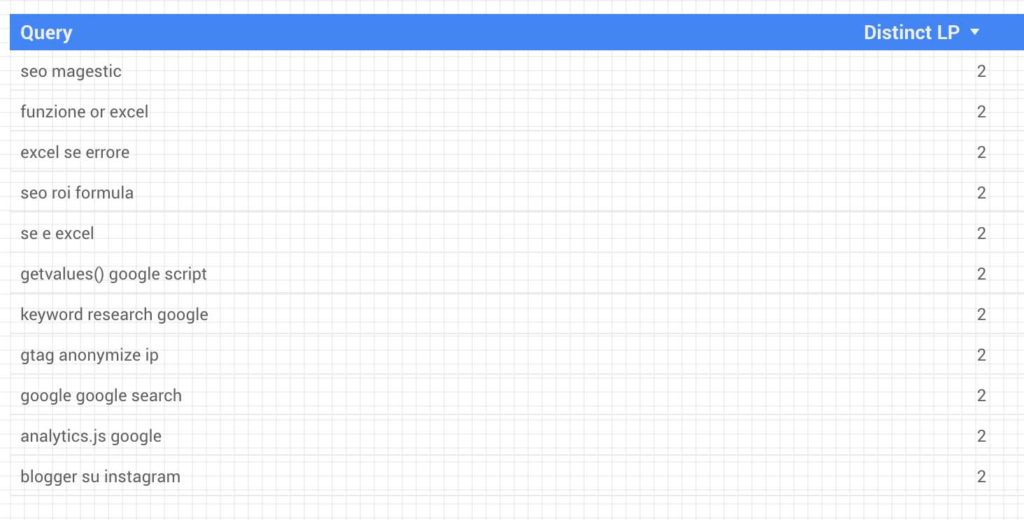
The formula is exactly the same we used for the number of unique search queries. The new filed must be a number and it can be used as a filter (e.g. you could list in a dropdown menu al the queries who are affected by keyword cannibalization).

This function isn’t perfect yet, because sitelinks are counted as a different page (you could at least exclude html anchor using a REGEXP_MATCH function nested inside the COUNT_DISTINCT)
5 From daily to monthly data

If you want to aggregate the data per month and not day, you have to open the data source dashboard.
Then you have to make a copy the actual date column and change the date format from YYYYMMDD to YYYYMM. With this method, you can keep both options available and decide later on which one you want to use.
Hi Ruben,
thank you very much for this article!
It’s pretty inspiring to see how to get more out of the GSC-Data.
Kind regards
Anton
You’re welcome!
Ruben,
Thanks for the great tips. Can you explain a bit more about “From daily to monthly data”, what is the benefit of aggregating data per day or per month ? In what case we should use per day / week / month / quarter
Hi Jeremy,
Yes, of course, I can elaborate a bit more about it! I think it’s very important to change the aggregation of the data in order to improve the readability of your charts. For example, if you have a chart showing the traffic development over the last 16 months and you use the daily aggregation, you won’t have a clear chart but only lines that look like the electrocardiogram result. While, if you use the monthly aggregation you’ll be able to read the chart in two seconds and find out that you’re organic traffic is going down.
Ruben
Awesome detailed post (Thank you).
One of the issues am encountering is creating a table showing the data by month.
1) the months are not set in order
2) displaying by year/month tends to generate so many rows of the same month
any chance of sharing tips how to overcome this issue please?
Hi Tala,
1) You should change the sorting of your table. You choose Date as sorting dimension and decide if you want the ascending or descending order.
2) It shouldn’t happen. Are you combining Year/Month with other dimensions?
Let me know if you need some more help.
Hey Ruben,
This is very informational. I am only stuck at one thing. How can I show different levels of hierarchy in a table, when data is directly coming from GSC. I can do the same using google sheets, but I want the dashboard to be automatic. The other thing is, there are many L2’s and L3’s. Can you help out?
Hi Randi,
if you want to show your hierarchy in a table you should add a field to the GSC dataset and use CASE WHEN to label the different URLs otherwise you could blend GSC data with a Spreadsheet where you put all your URLs already labelled.
What do you mean with “there are many L2’s and L3’s”?
Best,
Ruben
che figata quest’articolo Ruben!
Non avevo capito la differenza tra Site Impressions e URL impressions, ora tutto chiaro.
Già che ci siamo… a Fiscozen.it stiamo assumendo Growth Hackers e Data Scientists. Non ho capito bene da che parte stai tu (mi sa entrambe 😛) cmq se ti va, facciamo una breve chiacchierata di approfondimento, non si sa mai!
Riguardo a Fiscozen: siamo partiti 3 anni fa, miriamo gestire 3M di Partita IVA online, in sostituzione al tradizionale commercialista. Abbiamo già 3000 clienti, business già profittevole, 3M€ di investimento dalla autorevole United Ventures. Facci un pensierino 🙂
grazie ancora per l’utilissimo articolo!
Vito
Grazie per i complimenti!
Dovresti anche aver ricevuto una mia email 😉
Ruben
Hey Ruben,
Should we be using the URL or Site data sources? Is it possible to blend both sources into one?
Hi Daniel,
it depends on what you want to show. Unfortunately, it’s not possible to blend the two data sources directly in Data Studio. If you want to do that, you should first download the data via the API and then connect a Google Spreadsheet or database table to Google Data Studio.
Hi Ruben,
Thank you for this guide – simple tweak can make Google Data Studio so much powerful!
I am trying to build a dashboard for user to manipulate different Google Search Console account – is it possible to put a define field in “Brand Keyword” – so the report will automatically filter out this brand keyword?
Yes, of course! If you created the column “Brand/Non-Brand” you can easily create a filter and exclude all the rows containing the “Brand” value.
Hi Ruben,
Thank you for this simple practices. They are very useful 🙂
Thanks! 🙂
Hi,
Do you know how to regex “average positon” for landing pages?
Thanks
Franco
What do you mean? You can create a table with Landing page as dimension and Avg. Position as metrics. Otherwise you should download the data via the GSC API.
Hi Ruben thanks for this great article. I am noticing that in my branded / non branded report, there are missing clicks. For example, the total row says 8k but the sum of the rows is 6.5k. Any idea what is happening?
I think it’s happening because GSC data are always sampled. Also if you look at the Search Analytics report in the UI, you’ll notice that the numbers in the chart are different compare to the data you have in the table.
Hey Ruben,
That’s a good article. The issue am facing is, mismatch of data’s between google search console and data studio.
I would explain my scenario;
http://www.example.com in search console shows 5000 impressions but in data studio it shows 4400 Url impression and 3700 site impression for the same search console data’s.
How should I show the exact search console impression in data studio?
Hey Joshua, sorry for the late reply.
It’s a bit tough to get the exact amount of impressions. This happens because GSC provide sample data and the sampling percentage varies on the different platforms (GSC itself, Data Studio,…). My recommendation is to pull the data directly from the GSC API, otherwise use the Data Studio report as a reference. I think the most important thing is to identify trends (new keywords, traffic drops,…) rather than to get the exact numbers. Unfortunately, we have to work with what Google give us.