

Finally, I have some time to put together the notes from Measurecamp on Saturday.
My 6th Measurecamp was quite an adventure this time. My outbound flight was cancelled and I took 13 hours to reach London (compared to the usual 2 hours) because I had to make a stopover in Malaga. Fortunately, it was truly worth it.
Conductrics – Include Surveys & NPS in A/B Testing

I really liked the approach used by the folks at Conductrics in developing their platform. A/B testing doesn’t always mean simply identifying the variant that maximizes revenue. In fact, certain tests may have an indirect impact on revenue but still have a positive impact on the overall CX.
Here’s why the platform permits the integration of surveys, feedback, and NPS measurements within tests: it allows for a more comprehensive evaluation of the qualitative aspects of the tested variations.
A bunch of random GA4 tips & gotchas

Then I attended Julius Federovicious‘s speech, where he discussed some gotchas and workarounds he had created to make the most out of GA4. I’ll try to list below the ones that were most interesting to me.
He explained how to use the User Purchase Journey report and discussed why sometimes the report isn’t populated correctly. In such cases, he elaborated on why it’s necessary to recreate it within Explore.
As you can see in the video below, he explained how to monitor searches with zero results in GA4.
Furthermore, he explained why there are slight discrepancies in GA4 between the actual transaction value and the UI value.
GA4 takes all orders in EUR currency, converts them to USD, and then reconverts them to EUR within the UI, leading to minor discrepancies.
Additionally, he shared links to two GTM templates. One, developed by Eivind Savio, allows for the passing of promotion and item list name values across the different GA4 EEC events. This ensures proper attribution throughout the user journey when interacting with a promotion or item list.
The second template, created by Mohr Stade, enables the re-pushing of events in the data layer that had been pushed before the consent information was loaded.
How to better understand your visitors
Ton Wessling, on the other hand, delivered a speech/discussion where he aimed to define 10 tips for better understanding your users.
His main point was that the percentage of experiments yielding results is decreasing, so there is a need to focus more on generating new test ideas and prioritizing them effectively.
For instance, he recommended continuously monitoring and studying the tests that competitors are conducting. He also shared a Chrome extension that allows you to track which A/B tests a website is currently running (compatible with Optimizely).
He also talked about how he leverages AI, such as ChatGPT, to simplify his life. For example, he uses Scite Assistant to have scientific papers summarized, allowing him to concentrate more on the conclusions drawn by the authors.
He also feeds ChatGPT with competitor reviews to extract their strengths and weaknesses according to their customers.
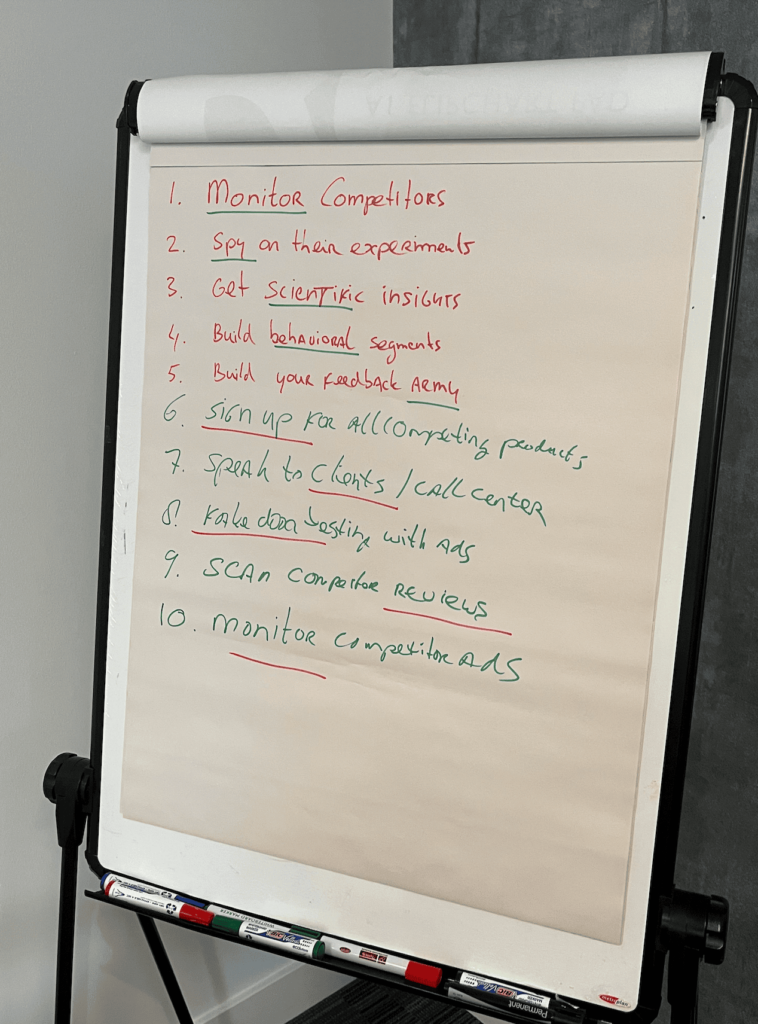
I also liked the tips that came out of the discussion. In the end, to understand our customers better, there’s nothing like engaging with them, whether through surveys, listening to customer care, or examining what they and our competitors are saying about us. This allows us to identify new opportunities for optimization.
He also mentioned UsabilityHub. I haven’t had the time to explore it yet, but I definitely plan to do so.
How BBC Sport measure their content effectiveness
The talk given by Piano Analytics addressed a topic that has always been widely debated.
In fact, at the end of the speech, there were several considerations and discussions regarding the effectiveness and results of the method used.
In 2021, BBC Sport decided to help their journalists understand how to write more engaging content for users.
They took all their content and grouped it by the number of characters used. Once they identified the median (250 characters), they took data from various studies that indicate how fast we read and calculated that, on average, a user takes 15 seconds to read a BBC article.

They then began to collect events that were triggered after 5-10-15 seconds from the start of the user’s page reading.
They started monitoring how many users reached the various time thresholds for each article to understand which articles were actually being read in their entirety by users.
As seen in the chart below, they also calculated an estimated reading time next to each article (reading speed x number of characters in the article).
This was done because, naturally, they had articles longer than 250 characters, so analyzing only the first 15 seconds wouldn’t be sufficient to measure effectiveness.

In conclusion, they found, for example, that including fan impressions in articles appears to be a topic that greatly interests readers.
And it also seems that they have some very interesting trends regarding the time spent on the website.
How to audit 300 GTM Containers
Sébastien Monnier‘s speech was also fascinating. He utilized a workflow automation tool called N8N (which I haven’t tested yet, but I’ll definitely look into it) to download all his containers through GTM’s APIs and then load them into BigQuery.

By creating daily downloads, he examines what has changed and what isn’t working so that he can monitor numerous containers simultaneously using straightforward dashboards in Looker Studio.
As usual, a lot of interesting insights and talks. I can’t wait for this weekend’s Measurecamp in Stockholm.