
As a marketer, one of the first things I do when I start to work with a new client is to check the Acquisition Report in Google Analytics – because it gives me an idea of the marketing activities and the performance of every single channel.
I usually use Google Analytics Add-on for Sheets or I connect the account with Google Data Studio where I have my own templates.
The problem is that the Data Studio connector and the Sheets add-on are based on the Google Analytics API – and currently, it’s not possible to use a Custom Channel Grouping as a dimension.
1. How to recreate a Custom Channel Grouping in Google Spreadsheet
First of all, you have to open Google Spreadsheets and install the Google Analytics Add-on. You’ll use it to pull the data directly from the Google Analytics database into the Sheet.

1. Go to Add-ons > Google Analytics > Create a new report and the reports builder should appear on the right-hand side.
2. Now you have to select the right Google Analytics account and choose the Metrics and Dimensions you want to have. The dimensions Campaigns and Source / Medium are fundamental for this tutorial. After the setup, you can click on Create Report.
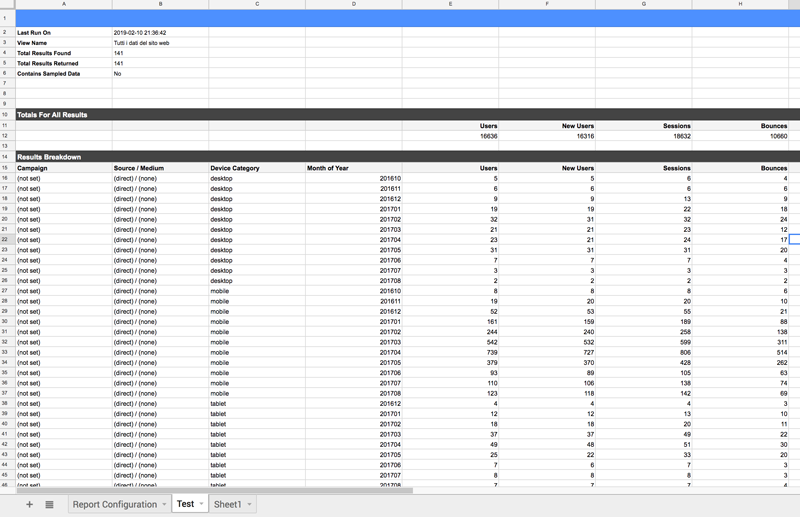
3. Change the date range and click (TIP: check out this page because I usually use functions like Today() or Yesterday() for the date range) on Run Reports. The add-on will create a new sheet where you’ll find all the data (make sure to generate an unsampled report!). Below you can see the result.
Now you have to add an empty column where you’ll add some Spreadsheets functions to determine the channel name of every row (I use Source/Medium/Campaign to determine the Channel Grouping). Here some of the functions you’ll use:
- REGEXMATCH() if the text matches the regular expression the function returns TRUE
- IFS() like the IF function, but it evaluates multiple conditions
- AND() the function returns TRUE only if all the arguments are TRUE
- NOT()it returns the opposite of a logical value NOT(TRUE) = FALSE or NOT(FALSE) = TRUE
You basically have to use these functions to define the rules you built in Analytics for your Custom Channel Grouping. Let’s analyze the table below:

1st row = the function returns the string “Direct” only if in the cells A2&B2 (I use the & sign to concatenate the two strings)are matching the regular expression. This is an easy case because there is only one condition (you’ll probably never use it!).
2nd row = the Campaign A could be a Google campaign or a Bing campaign – that’s why I used the AND() function to return “Bing Ads” only if the conditions “contains Campaign A” and “does not contains google or display” (as I said before, if you use the function AND() all the arguments must return TRUE and that’s why I combine the REGEXMATCH() function with the NOT() function. E.g. NOT(REGEXMATCH) = TRUE) are both TRUE. I also used the | sign to create an OR rule inside the same REGEXMATCH() function.
3rd row = if you want to recreate a Channel Grouping you’ll have to create a long formula that uses multiple conditions – that’s why you have to use the function IFS() to include multiple rules in one cell. In this case, I also used the regex [Dd]isplay which basically matches the strings “display” and “Display” (it can happen to have campaigns with uppercase and lowercase letters).
4th row = here you have an example of a formula that works when you have traffic coming from the same traffic source (e.g. Google) but that should be split in different channels (e.g. SEA, SEO & Display).
Common Combinations
IFS(Conditions 1,”Value 1″,Conditions 2,”Value 2″,…) = this is how I the formula should look like. A channel is defined by multiple conditions.
REGEXMATCH(string1|string2|string3|…) = the cell should contain one of the strings (E.g. Google, Bing, Yahoo, DuckDuckGo,..).
NOT(REGEXMATCH()) = the cell shouldn’t contain a specific string.
AND(REGEXMATCH(),NOT(REGEXMATCH())) = when a cell should contain a specific string but at the same time do not contain another one (e.g. the campaign should be “Campaign A” but the source shouldn’t be “bing”).
2. How to recreate a Custom Channel Grouping in Google Data Studio
Also, the Google Analytics connector is following the API rules and that’s why you have to recreate your Custom Channel Grouping. The whole process it’s a bit easier and faster compare to the other one.

- Open your Data Source and click on Add a field
- Here you have to use the CASE formula to define multiple conditions to the data
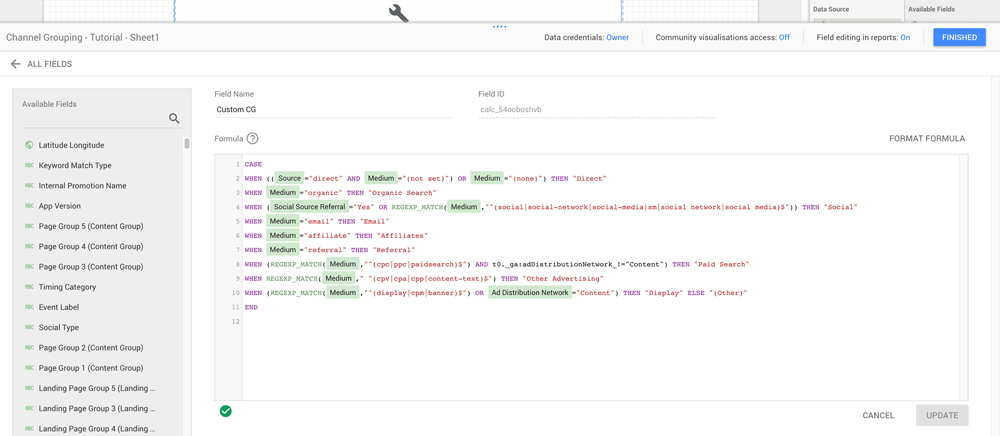
As you can see you have to use the commands WHEN … AND/OR… THEN to group all the different campaigns into the different Marketing Channels. Also here you have to use some regular expressions.
|
1 2 3 4 5 6 7 8 9 10 11 |
CASE WHEN ((Source="direct" AND Medium="(not set)") OR Medium="(none)") THEN "Direct" WHEN Medium="organic" THEN "Organic Search" WHEN (Social Source Referral="Yes" OR REGEXP_MATCH(Medium,"^(social|social-network|social-media|sm|social network|social media)$")) THEN "Social" WHEN Medium="email" THEN "Email" WHEN Medium="affiliate" THEN "Affiliate" WHEN Medium="referral" THEN "Referral" WHEN (REGEXP_MATCH(Medium,"^(cpc|ppc|paidsearch)$") AND Ad Distribution Network!="Content") THEN "Paid Search" WHEN REGEXP_MATCH(Medium," ^(cpv|cpa|cpp|content-text)$") THEN "Other Advertising" WHEN (REGEXP_MATCH(Medium,"^(display|cpm|banner)$") OR Ad Distribution Network="Content") THEN "Display" ELSE "(Other)" END |
Use a Custom Channel Grouping will help you to better understand the value of the different traffic sources and plan the next steps using accurate data.
Hello, very interesting article, thank you.
In Google Analytics, when you create a custom channel grouping the rules for each channel are applied in a specific order so a session will not be in more than one channel. Is it the case for the data studio formula?
Thank you in advance for your help!
Hi Diane, sorry for the late reply. The Data Studio formula works exactly like the Custom Channel Grouping – so every single session is attributed to only one channel.
Best,
Ruben
Hi rubenvezzoli can we you please share formula for system define rules in data studio.
Hi Rushikesh,
You don’t need a formula for the system defined channel grouping. You can simply use the channel grouping dimension 🙂